2019 Survey: Methodology
119 Survey Interviews
The 2019 Menino Survey of Mayors uses a combination of open- and closed-ended questions to explore myriad, salient local issues and policy priorities. This year, 119 mayors discussed everything from infrastructure and transportation, to workforce development, to the Opportunity Zones program. To generate a systematic sample, we invited all mayors of cities with 75,000 or more residents to participate. Each mayor received an email invitation from the Boston University Menino Survey of Mayors team at their official email account, and follow-up phone calls. The vast majority of interviews were conducted in person or over the phone. This systematic sampling and recruitment effort yielded a representative sample of mayors of American cities with populations over 75,000. Table 1 compares the demographics of participating cities to all cities with over 75,000 residents.
Table 1. Demographic Comparison of Sample Cities to All U.S. Cities with Populations >75,0001
| Survey | All Cities | |
|---|---|---|
| Number of Cities | 119 | 480 |
| Avg. Population | 228,925 | 224,929 |
| Avg. Pct. White | 53% | 49% |
| Avg. Pct. Black | 16% | 14% |
| Avg. Pct. Hispanic | 21% | 25% |
| Avg. Median Housing Price | $232,672 | $276,929 |
| Region | % of Sample | % of Cities |
| Midwest | 16% | 16% |
| Northeast | 15% | 10% |
| South | 34% | 33% |
| West | 35% | 41% |
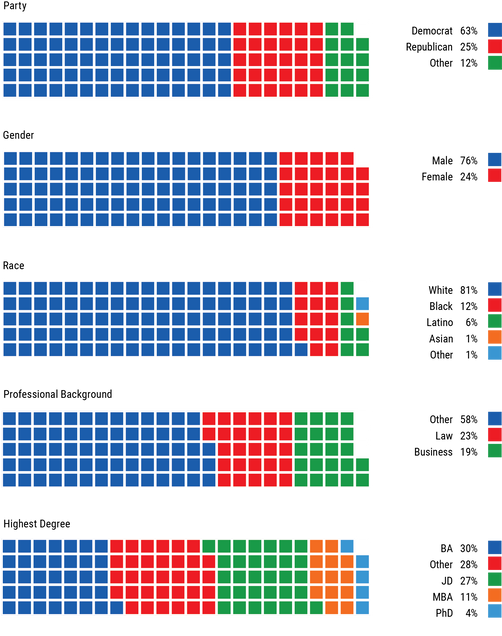
Figure 1: Demographics of Surveyed Mayors
- Source: 2017 American Community Survey (ACS), published by the US Census Bureau. [return]