Methodology
115 Survey-Interviews
The 2017 Menino Survey of Mayors explores a mix of issues and challenges and combines closed and open-ended questions. This year, the mayors discussed everything from performance metrics to housing development to sustainability.
To generate a systematic sample, we invited all mayors of cities with 75,000 or more residents to participate. Each mayor received an email invitation from the Boston University team at their official account, and follow-up phone calls. The vast majority of interviews were conducted in person or by phone.
This systematic sampling and recruitment effort yielded a representative sample of American cities. One hundred and fifteen mayors completed the Survey, which equates to a 25 percent response rate. This is very strong for a survey of busy elites. Moreover, the 115 participating cities nicely match the target population of cities over 75,000 residents (see Table 1). Participating cities were virtually identical to the national population of cities on population, racial demographics, housing prices, and geographic breakdown.
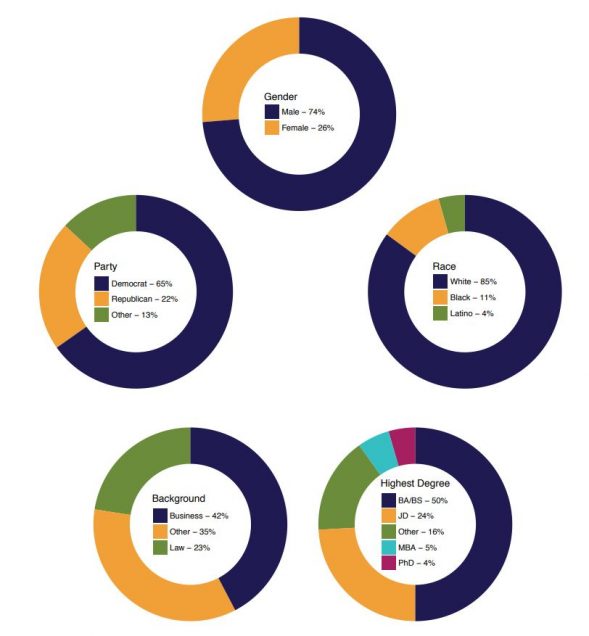
The sample of participating mayors captures the breadth of America’s city leaders (see Figure 1). Twenty-six percent are female and 85 percent are white. Sixty-five percent are Democrats. All three of these figures are consistent with the traits of the mayors in last year’s Menino Survey. The partisan distribution also closely aligns with a rigorous political science study of mayoral partisanship. As Figure 1 shows, as a group, the mayors have a mix of educational and professional backgrounds. Twenty-four percent of the mayors have law degrees and 23 percent have actual legal career experience. This compares with nearly 40 percent of members of Congress (Swanson, Washington Post, 1/19/16).1
Table 1: Demographic Comparison of Sample Cities to All U.S. Cities with Population >75,0002
| Survey | All Cities | |
|---|---|---|
| Number of Cities | 115 | 467 |
| Avg. Population | 233,086 | 224,762 |
| Avg. Pct. White | 55% | 50% |
| Avg. Pct. Black | 16% | 14% |
| Avg. Pct. Hispanic | 19% | 25% |
| Avg. Median Housing Price | $238,719 | $245,783 |
| Region | % of Sample | % of Cities |
| Northeast | 9% | 10% |
| Midwest | 25% | 16% |
| South | 27% | 33% |
| West | 39% | 40% |
Figure 1: Demographics of Surveyed Mayors