Budgets and Federalism
Confronted with mounting federal and state budget cuts, mayors continue to examine new ways to fund basic city services and capital needs. Mayors are concerned about the level of financial support they receive from superior governments, particularly given the critical role that government transfers play in municipal fiscal health. Mayors regularly cited a lack of state and federal funds as the primary obstacle to expanding housing access at the local level (see Figure 7). Mayors are confident that, on average, they can meet just 52 percent of their city’s infrastructure needs over the next five years.
As they were two years ago, mayors are pessimistic about the financial support they are receiving from other levels of government. If anything, they are more pessimistic today. When asked how much support their cities receive from federal or state government, more than one-half feel they get “less than average” relative to their peers. Only 7 and 10 percent, respectively, feel they get “above-average” support (see Figure 14). In actuality, unless the distribution of funding is very strange, more participating cities receive above-average support than they believe they do. The responses are likely capturing the general sense that cities are not getting what they need. The most severe pessimism concerns state government. Mayors much more frequently placed their cities in the most extreme negative category of “much less” support from their respective state governments.
Mayors are also expressing more pessimism than they did two years ago. While roughly the same portion of mayors believe they get either “less” or “much” less than average support from their state governments, about 10 percent of mayors have moved into the “much less” category making it the most common response in 2017 (Figure 15). More notably, about one-half as many mayors (9 percent in total) say they receive above-average support from the federal government than they did two years ago, when approximately 20 percent were on the optimistic end of this scale. As the figure shows, the proportion indicating “more support” from the federal government declined notably from the 2015 to the 2017 Surveys.
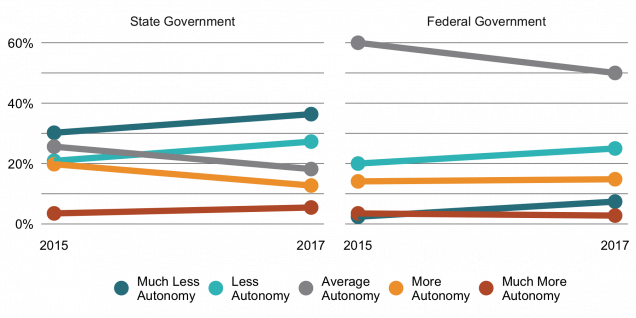
Mayors’ responses to an analogous question about autonomy and preemption varied considerably more based on which level of government they were describing. As one would expect, since federal law is essentially common to all cities, mayors tended to say that federal laws give their city an “average” level of autonomy compared to other cities (see Figure 16). In contrast, many mayors provided very negative answers regarding their state governments. “Much less” autonomy than average was the most common response, followed by “less than average.”
Mayors are feeling even more unfairly treated by their states when it comes to their own autonomy, relative to just two years ago. The general reality of mayors lamenting limitations on their autonomy was unchanged. In both 2015 and 2017, the “less than average” options were the most commonly used. However, the proportion of responses falling into both the “less” and “much less” options increased in 2017, while those reporting “average” and “more” autonomy decreased (Figure 17). Similarly, the number of mayors who responded that their city had average levels of autonomy from the federal government declined by 10 percentage points, while those responding “much less” and “less” autonomy increased.
Republican and Democratic mayors are feeling similarly—if poorly—treated by higher levels of government. Mayors’ perceptions of fiscal support and autonomy are independent of their partisan affiliations and, presumably, their policy positions (see Table 13). The average Democrat and the average Republican fall into the “less than average” category for financial support and autonomy at both levels of government. It is not the case, for example, that Democrats are complaining more about funding because they want to spend more, or that Republicans feel less constrained by the federal government due to unified party control. The biggest difference between Democrats and Republicans on any of these questions was a mere .2 on a five-point scale.
Table 13: Mean Financial Support and Autonomy, by Mayor’s Party
| Democrat | Republican | Other | |
|---|---|---|---|
| Financial Support: State | 2.3 | 2.2 | 1.9 |
| Financial Support: Federal | 2.5 | 2.3 | 1.9 |
| Autonomy: State | 2.2 | 2.3 | 2.4 |
| Autonomy: Federal | 2.8 | 2.8 | 2.7 |
Figure 14: Financial Support
Compared to an average city nationwide, how much financial support do you expect your city to receive from each of the following other governments in the next year?
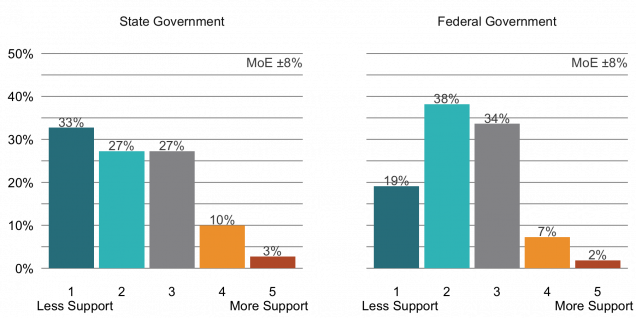
Figure 15: Financial Support Over Time1
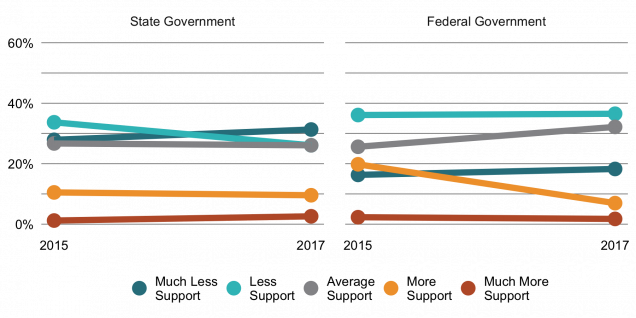
Figure 16: Policy Autonomy
Compared to an average city nationwide, how much do you expect laws and regulations (existing and new) from each of the following other governments to limit your city’s policy making autonomy and flexibility?
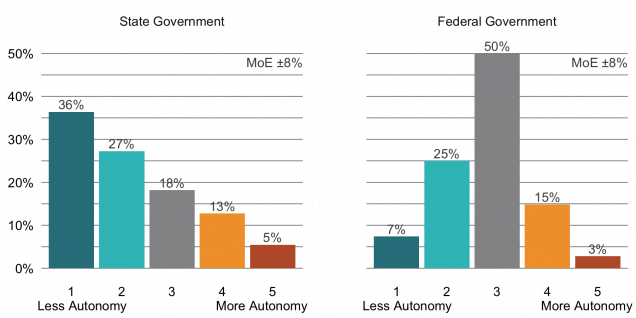
Figure 17: Policy Autonomy Over Time2
Lobbying Federal and State Governments
Mayors and their cities rely on a mix of tactics to influence policy-making at higher levels of government. Given their need for fiscal support, worries about autonomy, and concerns about policy choices, it is not surprising that cities and mayors, like other special interests, lobby and attempt to shape other governments’ actions. However, the mayors’ responses to an open-ended prompt about influencing policy suggests there is no one dominant tactic for pursuing the city’s policy priorities in the state capital and in Washington, DC.
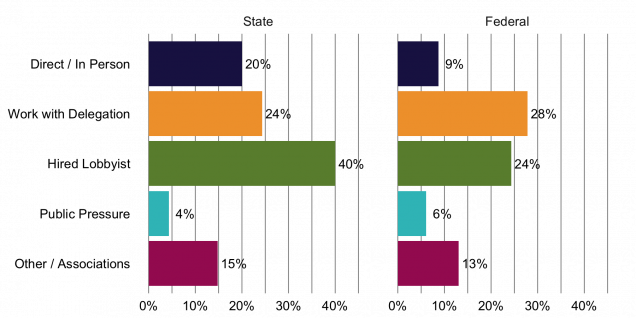
When it comes to influencing policy at both the state and national levels, the two most commonly cited approaches are utilizing paid lobbyists and working with one’s legislative delegation (see Figure 18). Forty percent of mayors cited hired lobbyists at the state level compared to only 24 percent at the federal level. At 40 percent, this was the closest thing to a consensus tactic in response to the question. Working with the legislative delegation was the most commonly cited tactic for influencing federal policy. The other notable difference between the two levels of government was that mayors more frequently cited in-person attempts at influencing state policy (e.g., face-to-face meetings at the capital or testifying in the legislature) relative to federal policy. This difference makes sense: relative to the federal government, the size and proximity of state government increases a given mayor’s ability to personally influence an agency choice or legislative committee markup.
Figure 18: Mayoral Approaches to Lobbying
Please describe your current plans and efforts to influence policy at the state and national levels. How, if at all, have your strategies changed since the 2016 election?
Responding to the Trump Administration
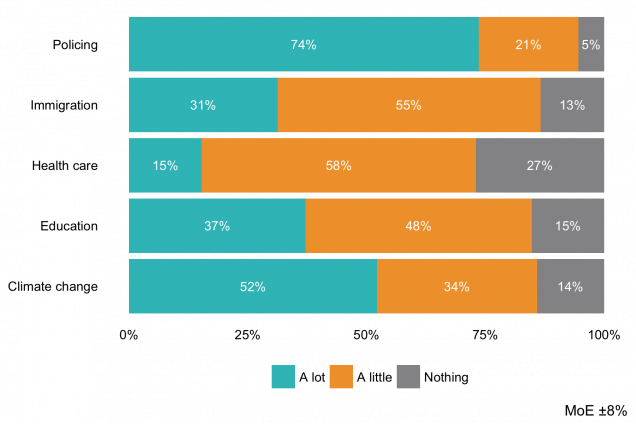
In the first months of the Trump administration, some cities and mayors very publicly challenged the president’s agenda and promised to take steps to oppose it. In general, mayors recognize limitations on cities’ ability to thwart federal policies with which they disagree. As shown in Figure 19, the area in which mayors reported having the most ability to counteract the president’s agenda was policing, which is also an area that mayors tend to have direct institutional prerogatives over. Nearly three-quarters of mayors said they could do “a lot” to counteract the administration in this area, and only five percent said they could do “nothing.” The second issue over which mayors claimed “a lot” of influence was climate change. This is an area in which cities’ coordinated opposition has been highly visible. As important are the areas in which mayors said they could do nothing. Healthcare, in which cities play a limited role, was the issue for which mayors most often said they can do nothing. Perhaps more surprisingly, 15 percent said they could do “nothing” about education policy and only one-third said “a lot,” despite education being an area in which the federal government provides relatively little money and has relatively little direct control.
Figure 19: Areas in Which Mayors Believe They Can Counteract Federal Policy
Many mayors have publicly stated they would take actions to counteract President Trump’s policies. Regardless of whether you agree with these mayors, for each of the following policy areas, how much can mayors do to counteract the administration’s policies?
While there are naturally partisan differences on a question such as this, there are also places where Democrats and Republicans gave similar answers. The area with the most divergence is climate change. Sixty-three percent of Democrats, many of whom were in the process of responding to the administration’s withdrawal from the Paris Agreement, said that cities can do “a lot,” compared to 24 percent of Republicans. The other area with some partisan divergence is policing, where 79 percent of Democrats said they could do “a lot” to counteract the administration, compared with 62 percent of Republicans. On the other hand, mayors’ responses were relatively similar about the potential for thwarting the administration in education and especially immigration. Finally, it is notable that across the board, Democrats were less likely, and, in all but healthcare, extremely unlikely, to say there was “nothing” they could do.
Table 14: Counteracting the Administration, by Party
| Democrats | Republicans | |||||
|---|---|---|---|---|---|---|
| A lot | A little | Nothing | A lot | A little | Nothing | |
| Climate change | 63% | 33% | 4% | 24% | 48% | 28% |
| Education | 39% | 52% | 9% | 33% | 38% | 29% |
| Health care | 21% | 56% | 24% | 4% | 62% | 33% |
| Immigration | 36% | 53% | 11% | 29% | 58% | 12% |
| Policing | 79% | 18% | 3% | 62% | 21% | 17% |
Mitigating Budget Cuts
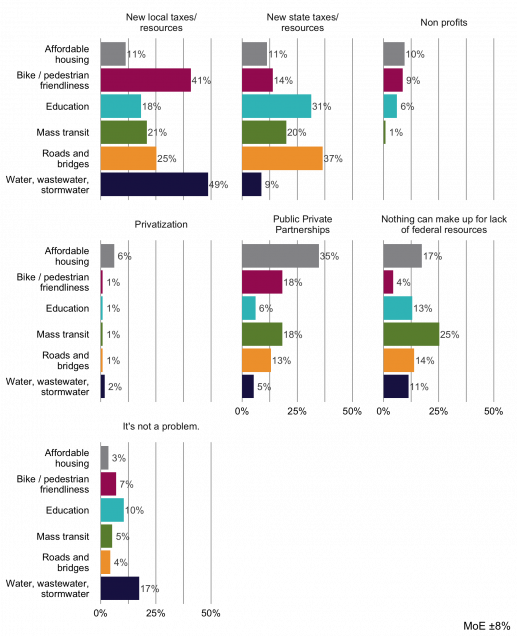
The mayors’ responses to other questions (see Section 5. Budgets and Federalism) point to serious concerns about funding in important policy areas and infrastructure priorities. Their evaluations of alternative sources of funding speak to the potential, or lack thereof, of mitigating the effects of federal shortfalls in key policy areas. In general, new taxes and resources at the state and/or local level were seen as the most promising ways to plug fiscal gaps (see Figure 20). Mayors especially cited state taxes as the funding sources they were most likely to pursue to make up for diminished federal resources for education and maintenance of roads and bridges, while citing local taxes in areas such as bike and pedestrian friendliness and water infrastructure. Mayors almost never saw nonprofits or privatization as plausible fiscal gap fillers in any issue area, though a few (roughly 10 percent) saw potential for these options in affordable housing provision.
According to the mayors, the more promising nongovernment option for filling gaps in housing funding is public private partnerships. With 35 percent of mayors choosing this response, public private partnerships were the most commonly cited pathway (i.e., more than relying on government alone) to meet funding shortfalls related to affordable housing. At the same time as public private partnerships were seen as the best option for housing, housing was seen as the most promising application of public private partnerships. Eighteen percent of mayors also saw strong potential for such partnerships in both public transit and bike infrastructure.
While some mayors were optimistic about options such as public private partnerships to make up for limitations on federal funding for affordable housing and transit, these areas were also most frequently cited as those in which “nothing can make up for a lack of federal funding.” Twenty-five percent of mayors selected this option in reference to mass transit, and nearly 20 percent cited it for affordable housing.
Figure 20: Alternate Sources of Funding
Federal budget reductions may make it harder for cities to fund important projects and functions. In the face of continuing or new federal budget reductions, which, if any, of the following are you most likely to pursue to help fill the funding gap? Please select one option for each spending category.